1편 > 전우주적인 암흑물질의 분포
이 삼차원 입체 지도는 우주의 대부분의 질량을 차지하는 것으로 추측되고 있으나 눈에는 보이지 않는 암흑물질의 전우주적인 분포를 처음으로 보여주는 지도이다.
이것은 천문학자들의 추론으로부터 전 우주적으로 미치는 암흑물질의 영향을 직접적으로 관측해낸 기념비적인 업적이다.
광속의 한계 때문에, 우리에게서 멀리 떨어져 있는 지역일수록 우리 눈에 보이는 것은 오래전에 존재했던 형상들이다.
이 지도는 시간상으로는 우주의 기원쪽으로 반 정도의 시공간까지 뻗어있는 지도이다.
이 지도는 중력의 무지막지한 인력장 내에서 붕괴가 발생할수록 물질 덩어리가 팽창하는, 암흑물질 필라멘트의 느슨한 연관관계를 밝혀주고 있으며,
빅뱅으로부터 시작된 초기 우주의 상대적인 균질상태로부터 어떻게 우주의 진화에 따라 구조들이 생성되었는가를 설명하는 이론을 확정하고 있다.
우선 처음에 암흑물질 필라멘트들이 형성되자마자 이들은 일상적인 물질들로부터 별들이나 은하들과 같은 구조들을 만들어내는 일련의 작용의 발판이 되었다.
암흑물질이 없이는 우주에서 천체의 붕괴와 은하의 생성과 같은 현상이 발생하기에는 그 질량이 턱없이 부족했을 것이다.
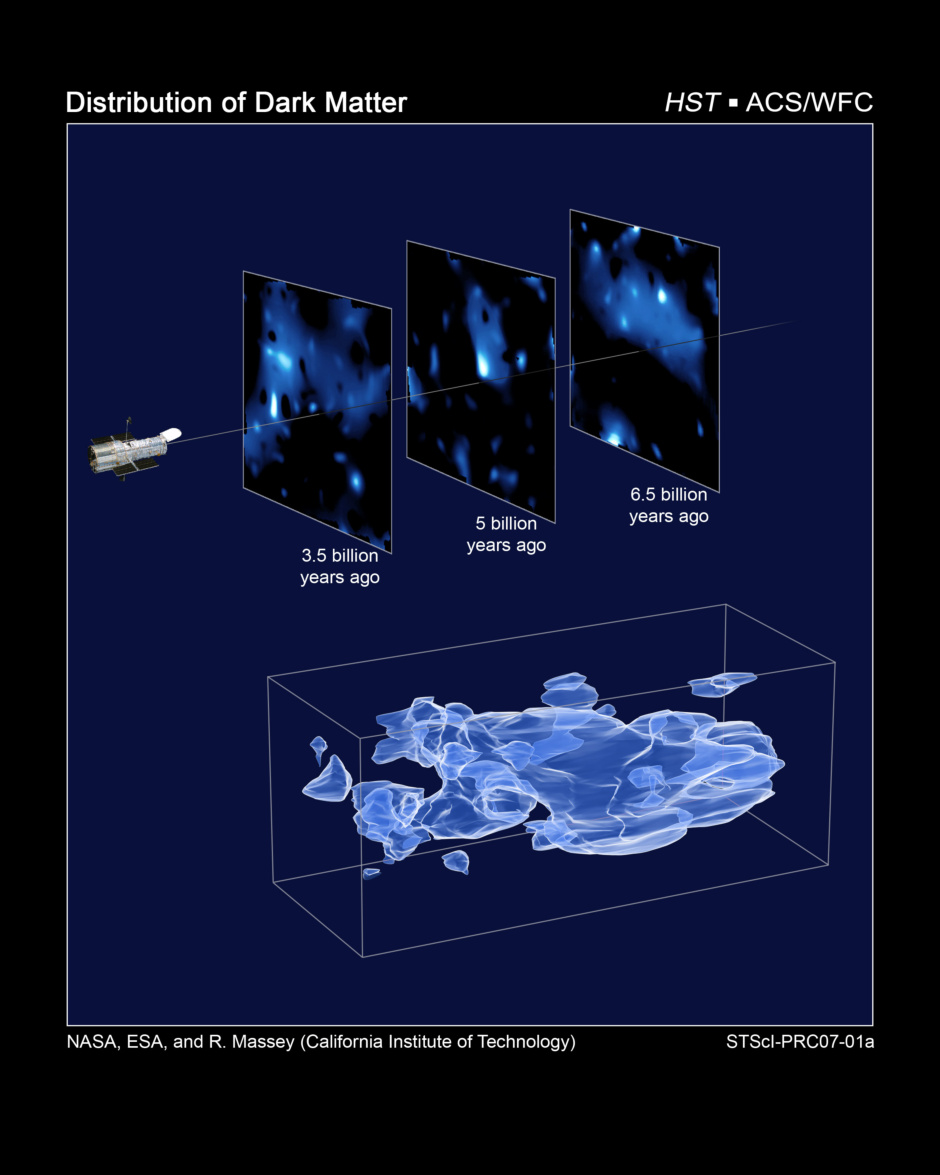
상단 그림 > 암흑불질 분포의 변화 양상을 나타낸 세 개의 단면이다.
이 데이터는 은하생성양상을 과거를 바라보는 방향으로 정렬하여 각 시대를 불연속적인 시기로 잘라내어 얻어진 것이다.
각 은하의 거리는 적색편이 측정을 통하여 측정되었고 암흑물질의 분포를 연관지은 후 이를 다른 시대 즉,
서로 떨어져 있는 단면에 배치함으로서 만들어진 것이다.
각각의 단면은 보름달 크기의 사각형을 9개 겹친 면적에 해당한다.
각각의 앵글은 주요 탐사대상으로 원뿔 모양으로 집중이 이루어지고 있는 것이어서 물리적으로는 왼쪽에서 오른쪽으로 갈수록
각 단면의 공간이 확장되고 있음을 유의해야 한다.
(왼쪽의 19메가파섹 거리에서 오른쪽은 31메가파섹으로 확장되어 있다.)
하단 그림 > 각 단면을 연결하면, 이와 같은 3차원의 암흑물질 분포 지도를 얻을 수 있다.
세 개의 축은 각각 우주의 각지점과 대응되며, 왼쪽에서 오른쪽으로 갈수록 적색편이로 측정된 바와같이 거리가 지구로부터 멀어지고 있는 것이다.
오른쪽에서 왼쪽으로 이동할수록, 즉 원시우주에서 최근의 우주로 이동할수록 암흑물질덩어리가 어떻게 점점 선명하게 나타나고 있는지에 주목하라.
이러한 암흑물질의 분포는 'COSMOS'(우주 진화 조사, the Cosmic Evolution Survey)라고 명명된 거대한 스케일의 조사를 통하여 얻어진 것이다.
이 자료를 얻기 위해 조금씩 가장자리가 중첩되는 575장의 연속적인 사진이 허블의 ACS(Advanced Camera for Surveys)로 촬영되었다.
이 작업에서 관측에만 걸린 시간은 1000시간에 달한다.
각 은하들까지의 거리는 하와이의 스바루 망원경으로 관측된 적색 편이를 통해 측정되었다.
참고 : 메가 파섹
1파섹의 정의는 다음과 같다.
지구가 태양 주위를 공전하게 되면서 그 공전 궤도를 원이라고 가정했을 때,
특정 지점에서 바라본 물체와 그 지점에서 원 중심을 통과하는, 즉, 지름의 반대 지점에 위치하여 바라보는 시차를 연주시차라 한다.
1 파섹이란 이러한 연주시차의 각이 1''(1초)로 수렴되는 지점을 말하는데 이는 3.26광년에 해당하는 거리이며 약 30조 8400억 킬로미터에 해당한다.
* '허블사이트'의 게시물들은 허블사이트 http://hubblesite.org 의 뉴스센터 자료들을 번역한 자료들입니다
참고> COSMOS Suvey의 성과에 대한 또다른 포스트
http://blog.daum.net/bigcrunch/12345554
http://blog.daum.net/bigcrunch/12346752
원문 >
ABOUT THIS IMAGE:
This three-dimensional map offers a first look at the web-like large-scale distribution of dark matter, an invisible form of matter that accounts for most of the universe's mass. This milestone takes astronomers from inference to direct observation of dark matter's influence in the universe. Because of the finite speed of light, regions furthest away are also seen as they existed a long time ago. The map stretches halfway back in time to the beginning of the universe.
The map reveals a loose network of dark matter filaments, gradually collapsing under the relentless pull of gravity, and growing clumpier over time. This confirms theories of how structure formed in our evolving universe, which has transitioned from a comparatively smooth distribution of matter at the time of the big bang. The dark matter filaments began to form first and provided an underlying scaffolding for the subsequent construction of stars and galaxies from ordinary matter. Without dark matter, there would have been insufficient mass in the universe for structures to collapse and galaxies to form.
[Top] - Three slices through the evolving distribution of dark matter. The dataset is created by splitting the background source galaxy population into discrete epochs of time (like cutting through geologic strata), looking back into the past. This is calibrated by measuring the cosmological redshift of the lensing galaxies used to map the dark matter distribution, and binning them into different time/distance "slices". Each panel represents an area of sky nine times the angular diameter of the full Moon. Note that this fixed angle means that the survey volume is a really a cone, and that the physical area of the slices increases (from 19 Mpc on a side to 31 Mpc on a side) from left to right.
[Bottom] - When the slices across the universe and back into time are combined, they make a three-dimensional map of dark matter in the universe. The three axes of the box correspond to sky position (in right ascension and declination), and distance from the Earth increasing from left to right (as measured by cosmological redshift). Note how the clumping of the dark matter becomes more pronounced, moving right to left across the volume map, from the early universe to the more recent universe.
The dark matter distribution was mapped with Hubble Space Telescope's largest ever survey of the universe, the Cosmic Evolution Survey ("COSMOS"). To compile the COSMOS survey, Hubble photographed 575 adjacent and slightly overlapping views of the universe using the Advanced Camera for Surveys' (ACS) Wide Field Camera onboard Hubble. It took nearly 1,000 hours of observations. The distances to the galaxies were determined from their spectral redshifts, using the Subaru telescope in Hawaii.
Object Name: COSMOS Field
Image Type: Astronomical/Illustration
Credit: NASA, ESA, and R. Massey (California Institute of Technology)
'3. 천문뉴스 > 허블사이트' 카테고리의 다른 글
| 허블망원경을 통해 이룩한 과학적 발견 -3- (0) | 2007.11.15 |
|---|---|
| 허블망원경을 통해 이룩한 과학적 발견 -2- (0) | 2007.11.14 |
| Carina Nebula, NGC3372 -3- (0) | 2007.11.12 |
| Carina Nebula, NGC3372 -2- (0) | 2007.11.11 |
| Carina Nebula, NGC 3372 -1- (0) | 2007.11.11 |